How to bury Longyearbyen by an avalanche?
Avalanche mass movement modelling
Where and how
Avalanches are rapid snow mass movements over snow covered slopes, which could be dangerous for people living in mountainous terrain due to long-time exposure. So, how to bury a town with a designed avalanche?
There must be enough snow on slopes. Sukkertoppen is a mountain close to the town of Longyearbyen, Svalbard. The north-facing side can accumulate a substantial amount of snow during wintertime, especially with easterly and south-easterly winds. In 2015 and 2017, there were avalanches hitting the houses close to the slope.
Software RAMMS::Avalanche® is able to simulate slab avalanche movement by Voellmy-fluid friction model.
Model construction
RAMMS is a Voellymy-fluid friction based model.This model divides the frictional resistance into two parts: a dry-Coulomb type friction (coefficient µ) that scales with the normal stress and a velocity-squared drag or viscous-turbulent friction (coefficient ξ). µ dominates when the flow is close to stopping, ξ dominates when the flow is running quickly.
\[S=\mu N+\frac {\rho g \boldsymbol{u}^2} {\xi} with N=\rho h \operatorname{gcos}(\phi)\]Since Version 1.6.20 the basic Voellmy equation has been modified to include a yield stress (cohe-sion). Many materials, like mud and snow, do not exhibit a simple linear relation (µ = constant),
\[S=\mu N+\frac {\rho g \boldsymbol{u}^2} {\xi} + (1-\mu) N_0-(1-\mu) N_0 e^{-\frac{N}{N_0}}\]For more information please refer to RAMMS_AVAL_Manual.
Model Inputs
- DEM
- Mu/Xi parameters: is inferred to friction parameters used in Voellmy-fluid equation.
- Release area information: as higher, bigger as possible. Slope is between 30° to 45°, the typical slope angel of slab avalanche.
- Release depth: thick snow pack is good, which is highly depended on local climate.
Model outputs
- Max flow height
- Max pressure
- Max velocity
- Deposits
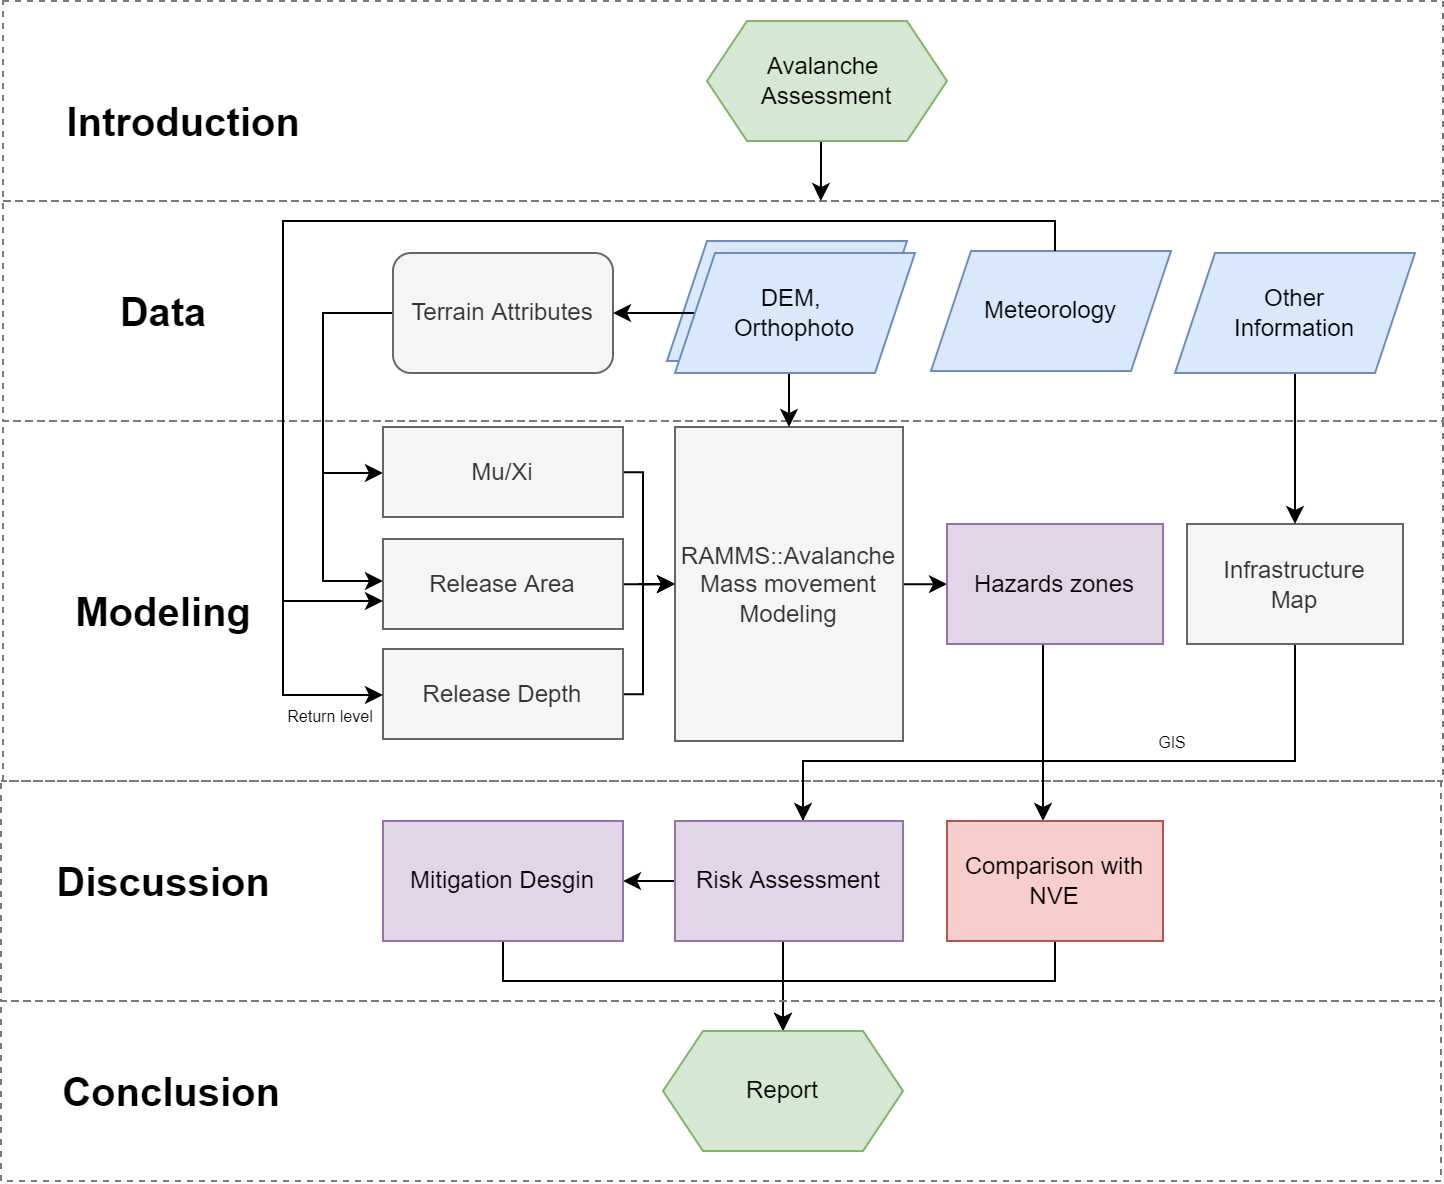

Experiment
Scenario - normal
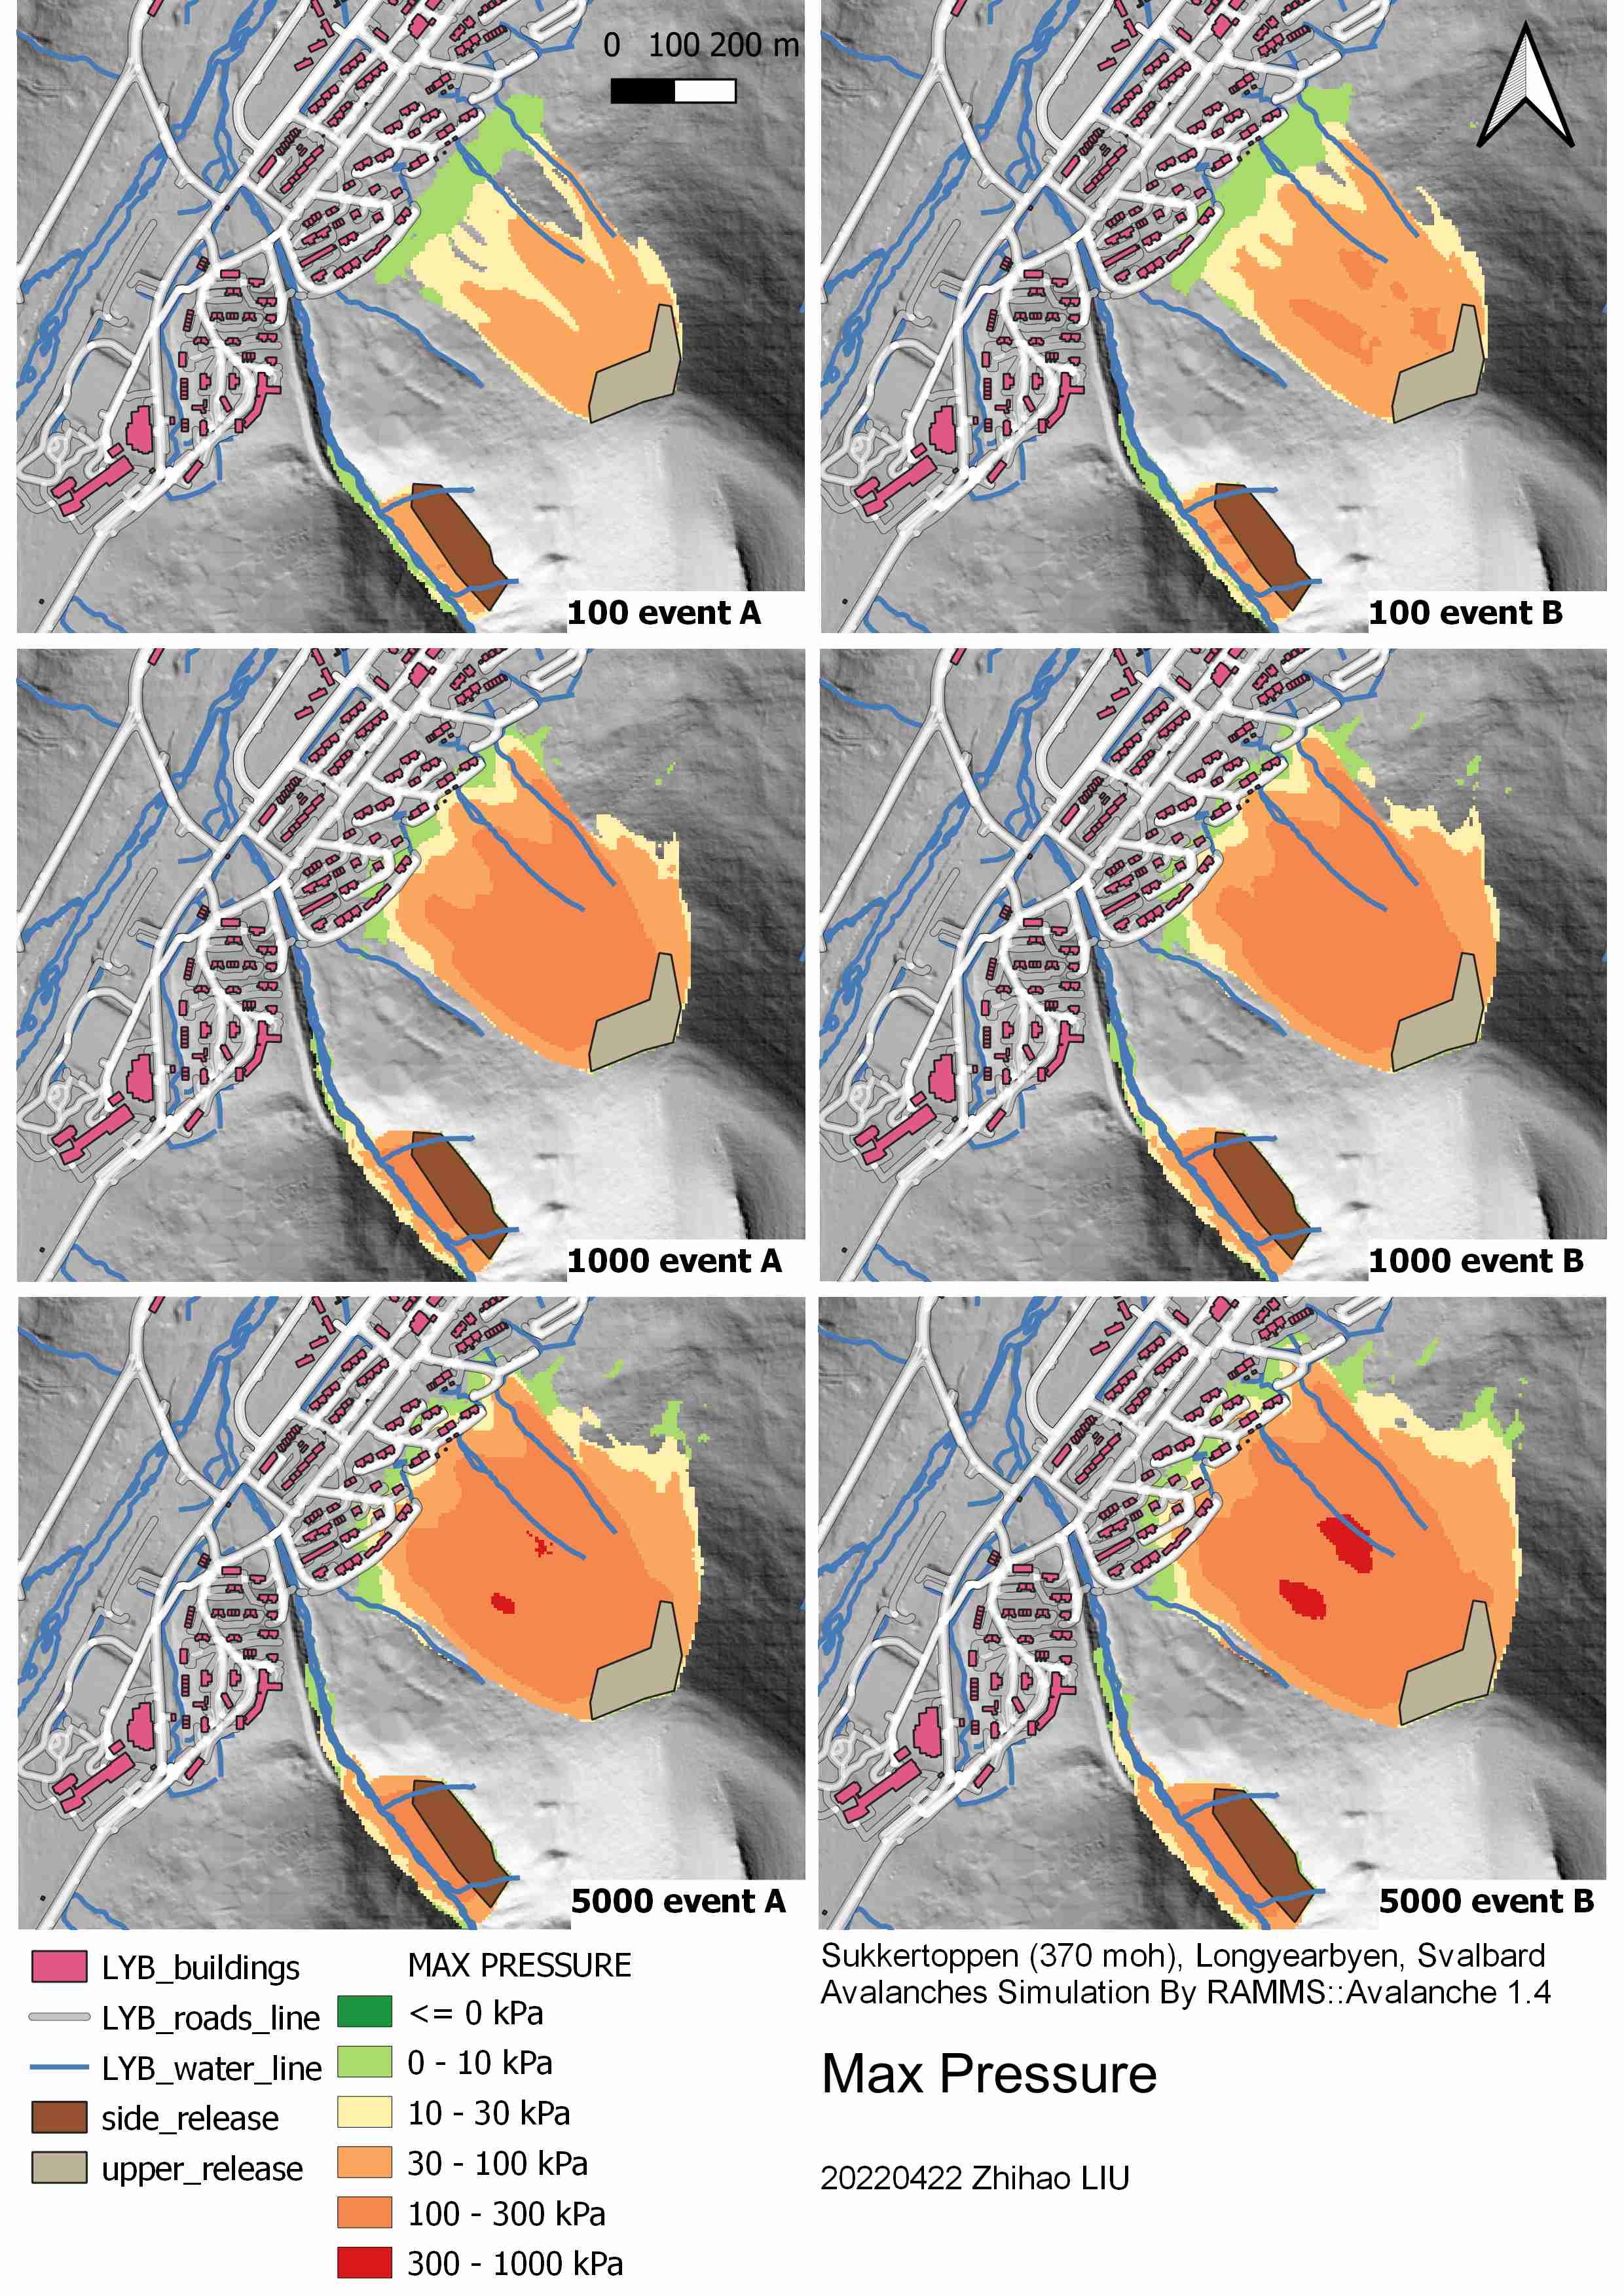
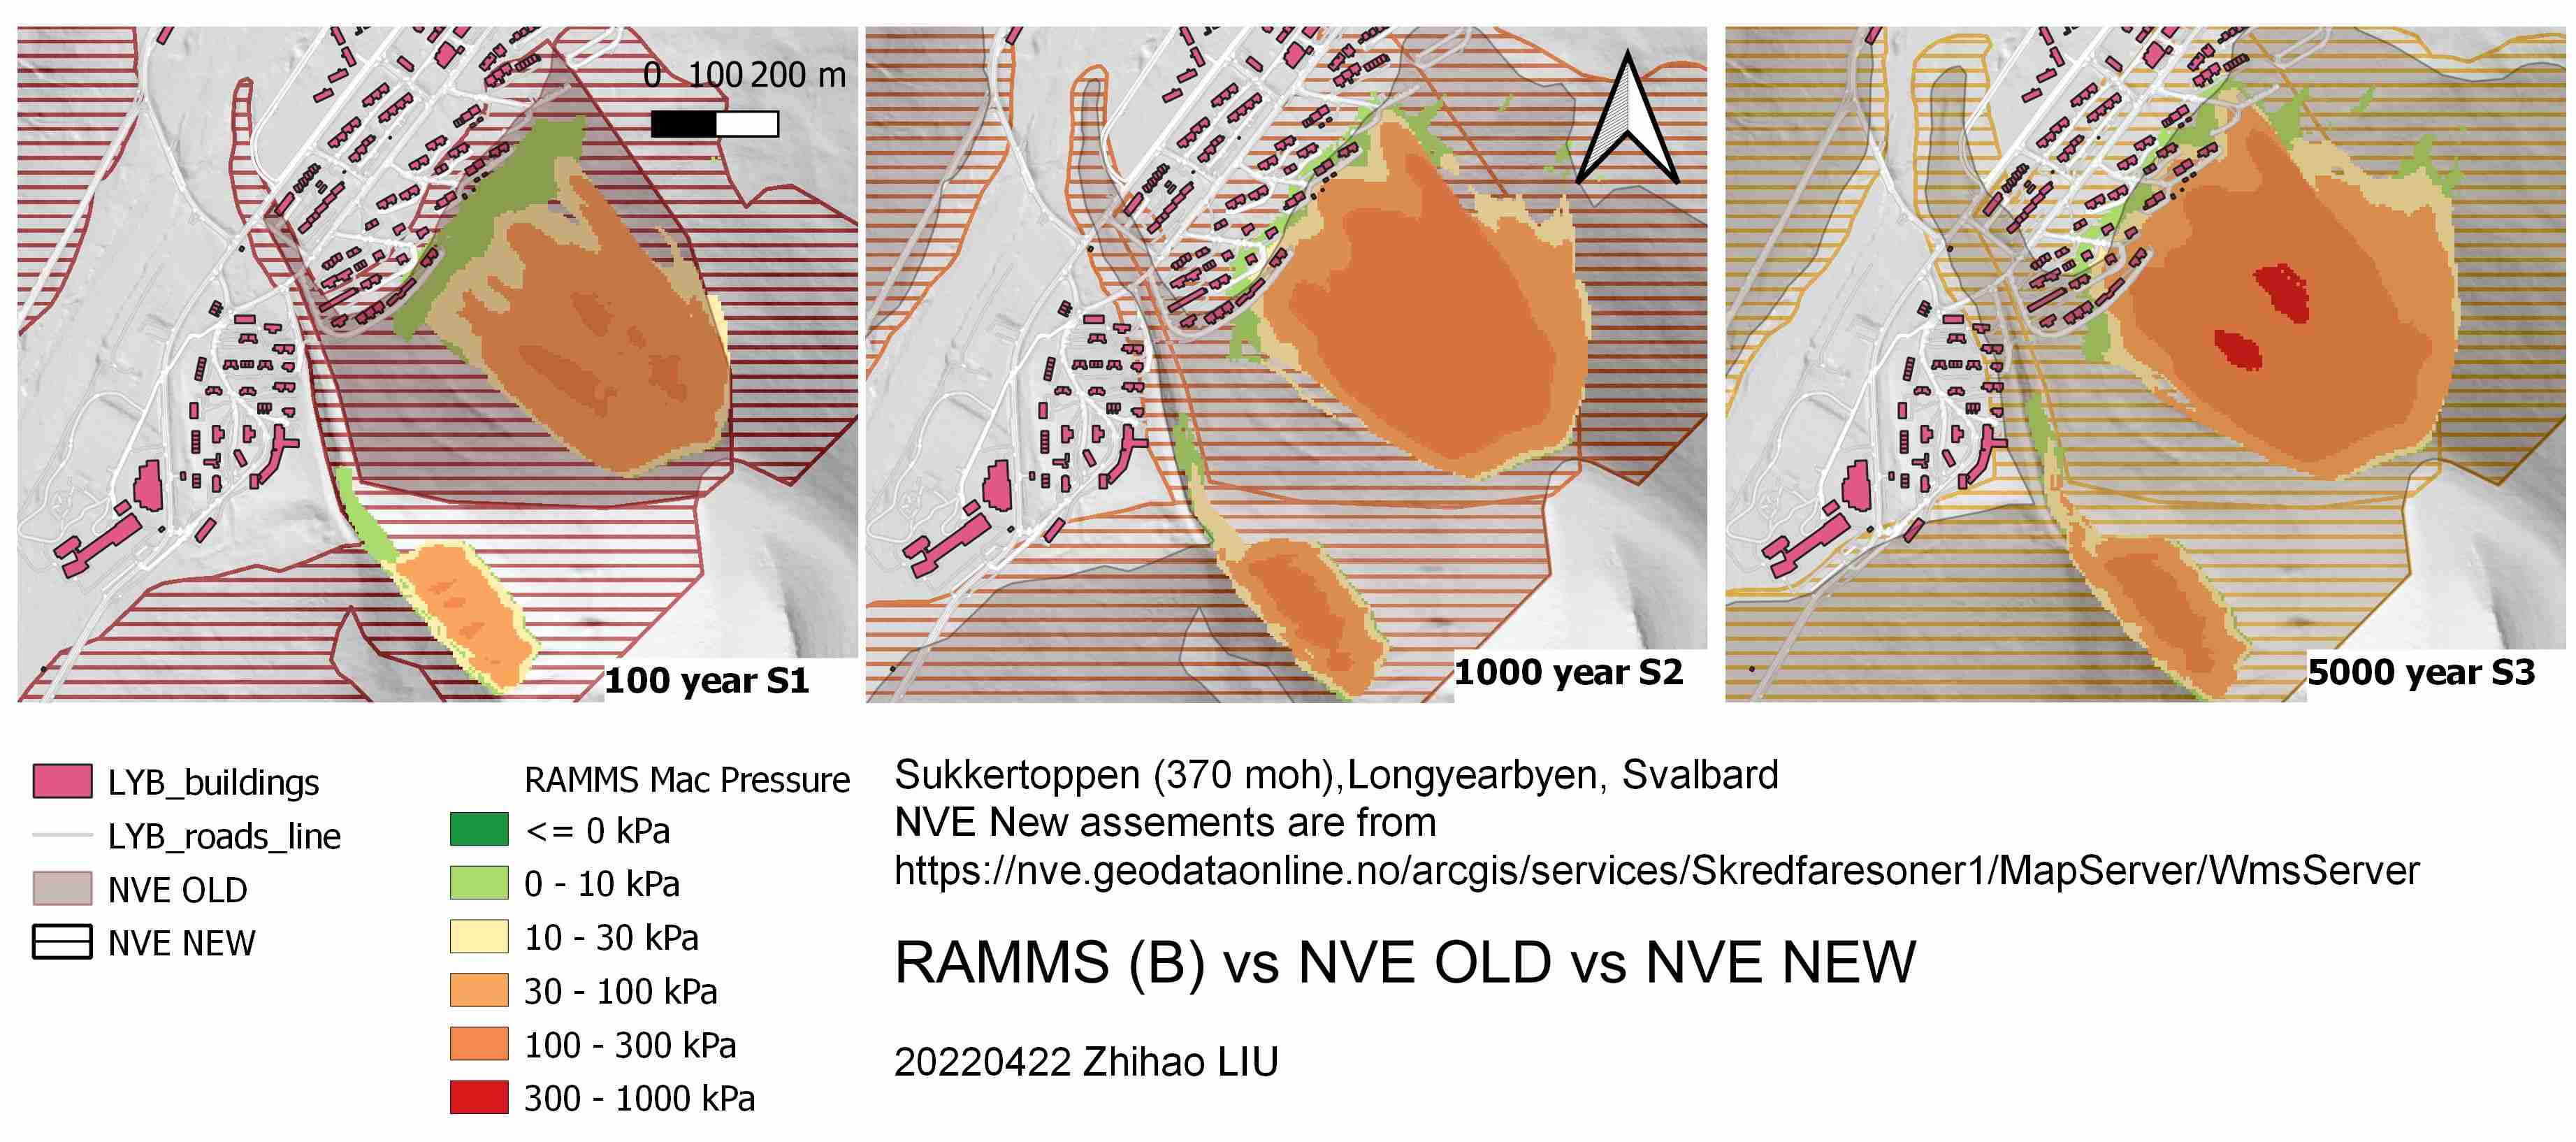
The run-out length is highly depended on release depth or release volume. Here is the normal scenario, starting with release depth 0.4 m to 2.2 m, corresponding to return period from 100 years to 5000 years. Group A is the lower estimation, and B is the upper estimation.
And we also compared the results with NVE’s evaluation.
| Event | mu/xi file | Release depth (cm) | Total Volume (m3) | Max Velocity (m/s) | Max flow height (m) | Max pressure (kPa) |
|---|---|---|---|---|---|---|
| 100_year_event A | 100S_150_50 | 40 | 16053 | 18.84 | 2.64 | 106.50 |
| 100_year_event B | 100S_150_50 | 70 | 28093 | 20.97 | 4.46 | 131.94 |
| 1000_year event_A | 300M_150_50 | 120 | 48160 | 28.66 | 6.37 | 246.39 |
| 1000_year event_B | 300M_150_50 | 150 | 60200 | 30.45 | 7.36 | 278.08 |
| 5000_year event_A | 300M_150_50 | 190 | 76253 | 32.10 | 8.34 | 309.12 |
| 5000_year event_B | 300M_150_50 | 220 | 88293 | 33.22 | 8.96 | 330.98 |
Scenario - Insane release depth
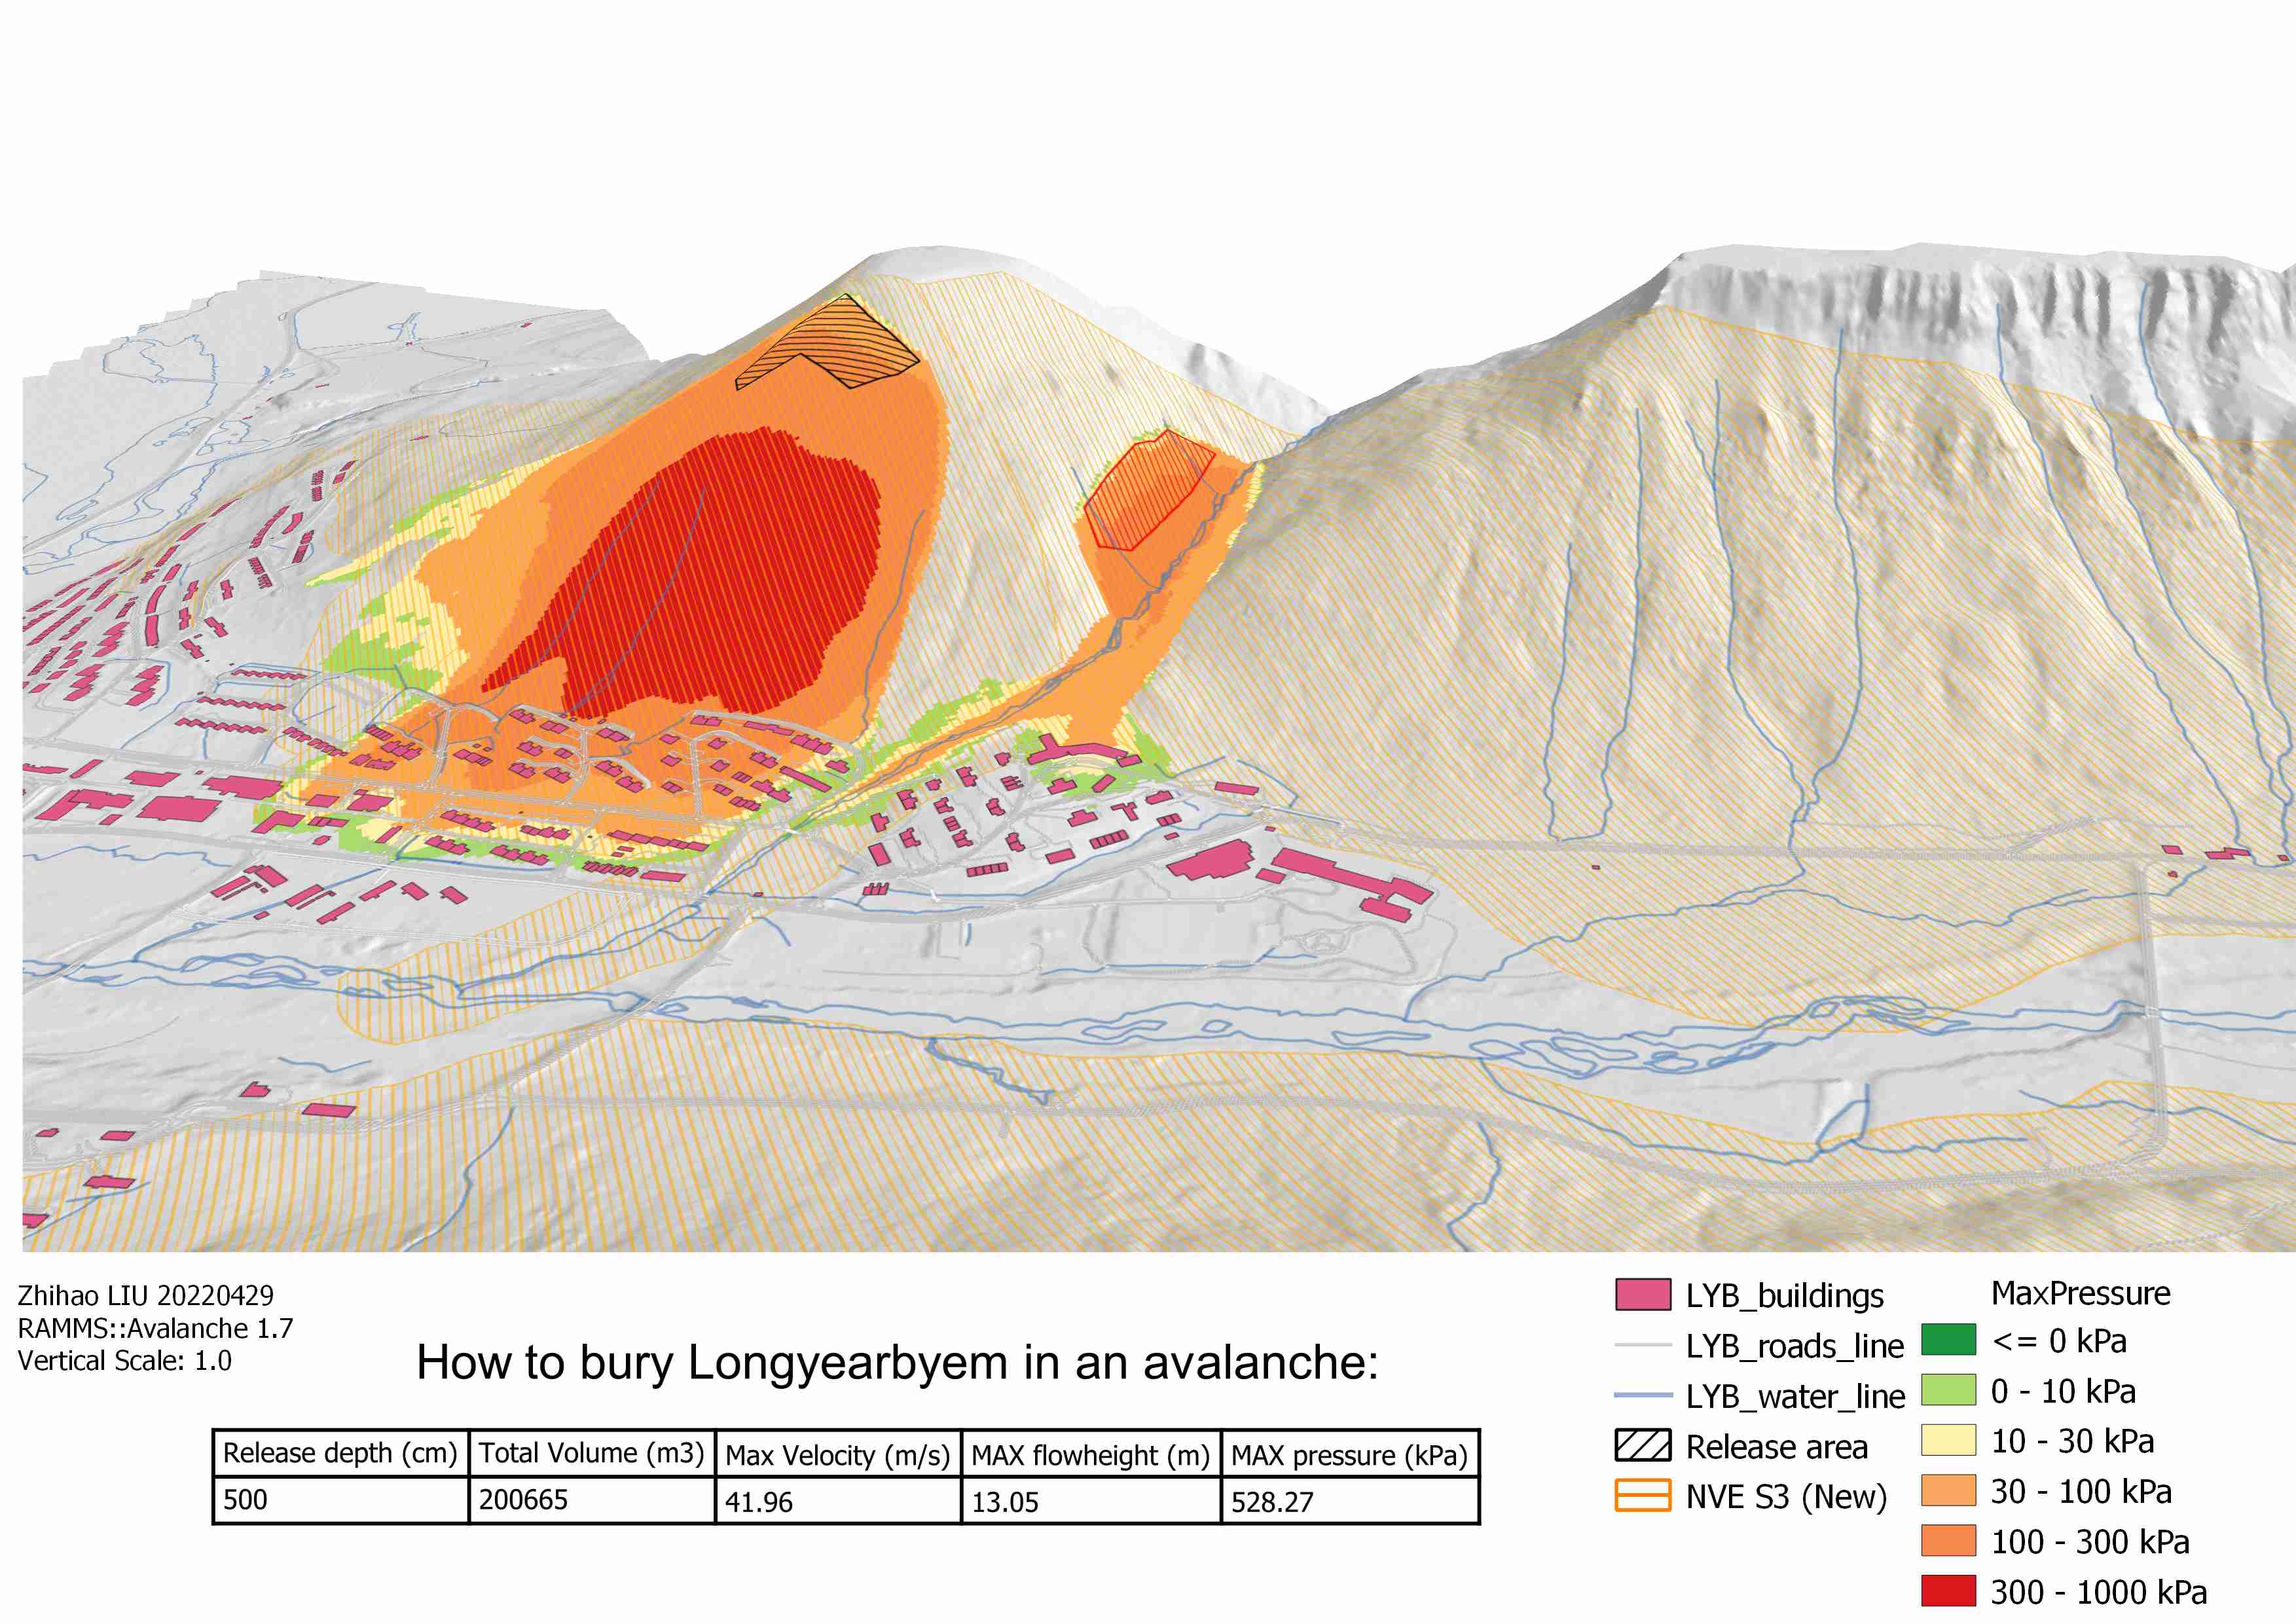
When release depth increases to 5 m, using mu/xi files 300L_150_50, the 10kPa boundary partly encounters with NVE S3. In few areas, the extreme avalanche even surpasses NVE S3. Additionally, the side release area with 5 m release depth still cannot support an avalanche to run as far as NVE S3.
Scenario - Insane release size
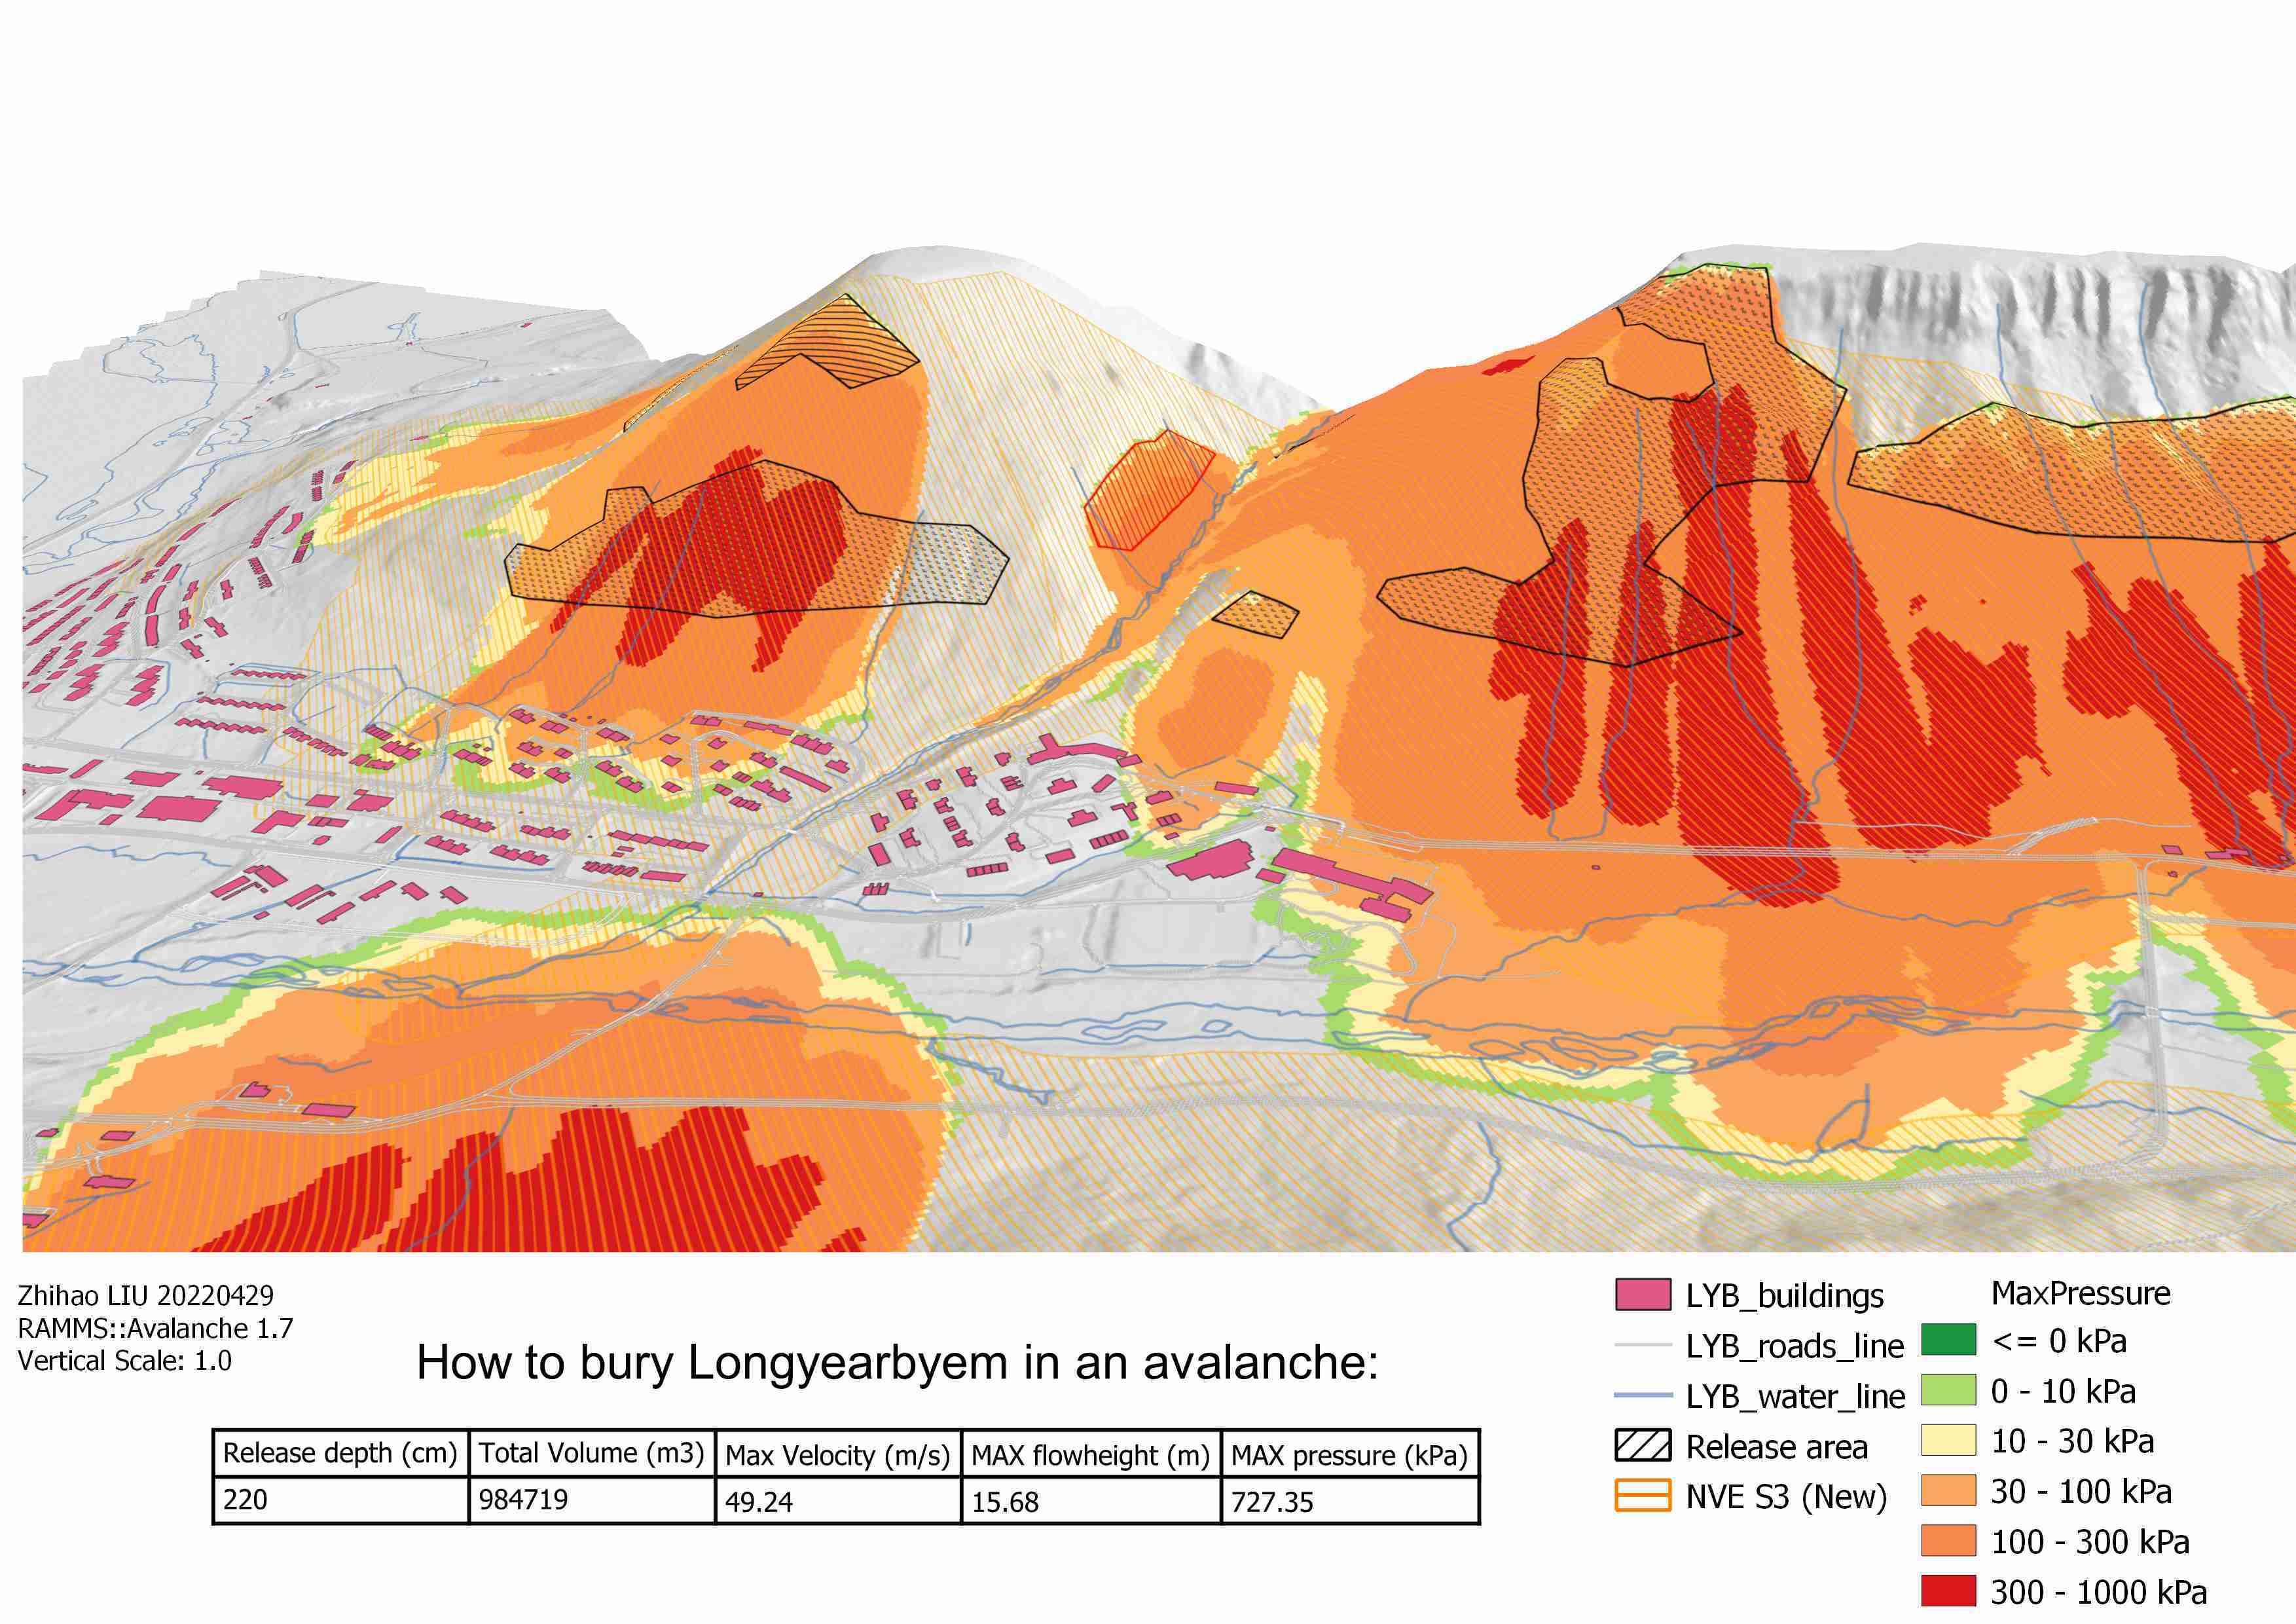
When release depth remains 2.2 m but the release area expands significantly, using mu/xi files 300L_150_50, figure below shows the results. At Sukkertoppen, the full extent of 10 kPa is slightly bigger than 5000-year-event-B, but far behind NVE S3. However, in other slopes, the avalanche fully surpasses NVE S3, which is what I am looking for, by extending the release area as much as possible.
Compared to an extreme-release-depth-event, an extreme-release-size-event is more likely to occur, as the 5 m release depth is clearly beyond the local climate truth.
Few thoughts
RAMMS results are highly dependent on release parameters (altitude, size, depth), particularly the size is not easy to decide. Therefore, I recommend that the model be run based on more field observations, such as, back analysis, rather than relying on pure assumptions.
RAMMS::avalanche is a slab avalanche run-out analysis tool. The main results are the distributions of pressure, velocity and fluid height. When we need to classify the area in danger, we can use the pressure. When it comes to design avalanche dams, we can use the velocity and the fluid height.
The aim of this study was to bury Longyearbyen as much as possible by an avalanche. The closest simulation is shown in figure, an avalanche with 2.2 m release depth and 447,600 m2 release size. In practice, if there is enough snow, this can be done by bomb blasting, which this report does not recommend.